Mineral and petroleum industry activity review 2020
Key indicators of the overall performance of the resources sector include the number of people employed, the level of investment and exploration activity, royalties received by the State Government and the number of principal mining projects.
Employment

Western Australia’s mining, mineral exploration and petroleum industries employed an average of 140,941 people (113,056 in full-time-equivalent or FTE terms) during 2020, representing a new record for a single calendar or financial year.1
The mining and mineral exploration industries were responsible for the lion’s share of employment, with an average of 139,790 people (112,057 FTEs) working in the industries during the year (also a record), compared to just 1,151 persons (999 FTEs) in the onshore petroleum industry.
The largest number of people were employed in the mining of iron ore (70,852 persons or 57,055 FTEs), while gold was the next highest with average employment of 32,218 (26,414 FTEs).
1This figure includes people employed in mine site infrastructure construction, mineral processing, mine site surveying, transport, and catering – essentially those people operating on site. DMIRS collects mining employment data from monthly accident reports, which all operating mines, as well as companies undertaking exploration activities on exploration and mining leases, are required to submit. The data identifies the number of direct employees and contractors and includes sites under State Agreement Acts. It does not include personnel in administrative locations not on operating sites. Petroleum employment data includes people employed at operating sites, including contractor employees. It comprises only operations subject to State petroleum legislation, and excludes LNG operations and land-based service operations. Employment data collected and published by the Australian Bureau of Statistics (ABS) is classified using ANZSIC and is not directly comparable to data collected by DMIRS.

Most of the growth in employment was due to increases in the iron ore industry amid production sustaining construction projects (up 6,234 persons or 8947 FTEs), and the gold sector (up 628 persons or 841 FTEs) amid higher prices, while employment in minerals exploration was also up 310 persons (410 FTEs).
Conversely, employment in the lithium industry was down 1,352 persons (2,337 FTEs) amid ongoing challenging market conditions. The larger fall in FTEs suggests that the State’s remaining lithium producers have managed the downturn in the industry by reducing worker hours rather than through layoffs. Employment in the onshore petroleum industry was also down 278 persons (269 FTEs) in an environment of lower prices.
Interestingly, employment in bauxite mining and alumina refining was up 2,429 persons but down 311 FTEs, reflecting a larger number of part-time workers on the Alcoa operations during 2020.

The COVID-19 pandemic had an impact on employment in the mining industry through changes to workforce practices, including limits on the total number of workers on site at any one time and changes to fly-in, fly-out shift schedules due to State-based restrictions and social distancing measures.
The impact of these restrictions and measures was most evident in April 2020 during the height of Western Australia’s COVID-19 restrictions. Mining employment numbers and FTEs declined by 13 per cent and 6 per cent respectively in April 2020 compared to March 2020.
However, by May and July 2020 respectively FTE and employment numbers in the mining industry had returned to pre-COVID-19 levels with the lag in employment numbers likely reflecting ongoing efforts to curb the spread of COVID-19 by limiting on-site numbers. By the end of 2020, both FTE employment and average employment numbers had surpassed pre-COVID levels.
In 2020, the impact of COVID-19 on mining employment was also evident in the difference between employment numbers and FTEs falling to its lowest levels in five years in April and May, suggesting people were staying on-site for longer during this period. However, by the end of the year the disparity between average employment numbers and FTEs had returned to pre-COVID-19 levels.
In the exploration sector, a fall in average employment numbers and FTEs was also observed in April 2020, reflecting cuts to exploration programs and spending during the period of Western Australia’s most restrictive COVID-19 measures. However, by June, employment numbers and FTEs in the exploration sector had largely exceeded pre-COVID-19 levels.
Overall, the figures suggest that employment numbers in Western Australia’s mining and exploration sectors have recovered from the early months of the COVID-19 pandemic and continued to strengthen. This likely reflects Western Australia largely being sheltered from its most severe global and national economic impacts.
Unfortunately, the same cannot be said for Western Australia’s onshore petroleum sector. Employment numbers declined by 373 persons (515 FTEs) in April and while they did begin to recover across the second half of 2020, they remained well below pre-oil price crash levels at the end of the year.
Investment
More than $20 billion was invested into the Western Australian mining and petroleum sector, up from $17 billion in 2019. This represents the highest level of mining and petroleum investment in Western Australia since 2017.
While this remains well below the boom time peak of 2012, higher levels of investment are a positive development. The result was largely achieved on the back of ongoing investments by major iron ore producers Rio Tinto, BHP and FMG in large-scale production sustaining projects, as well as FMG’s Iron Bridge magnetite project.
Western Australia’s share of national mining and petroleum investment increased to 57 per cent due to greater levels of investment growth in Western Australia compared to the rest of the country. The State’s share is now slightly above its 10-year average share of 56 per cent.

The resources sector was primarily responsible for growth in total new capital expenditure in Western Australia to $27 billion, up from $25 billion in 2019. The increase in mining investment helped Western Australia to increase its total share of Australian new capital expenditure to 23 per cent in 2020, compared to 19 per cent in 2019.
COVID-19 did not have immediate impact on levels of mining and petroleum investment in Western Australia. In the June quarter, mining investment was up 13 per cent compared to March quarter and up 20 per cent compared to the same period in 2019. The September quarter and December quarter were also up 12 per cent and 11 per cent respectively compared to the same periods in 2019.
DMIRS also monitors and collects information on mineral and petroleum development projects in Western Australia to estimate levels of investment in the future.2
As of March 2021, Western Australia had resources projects in the development pipeline valued at an estimated $140 billion, up from the September 2020 estimate of $129 billion.
2Mineral and petroleum projects are categorised as follows:
– Under construction – those actually under construction.
– Committed – company has reached a positive final investment decision (FID).
– Planned – those that have completed advanced feasibility studies including definitive and bankable feasibility studies.
– Possible – those at an early stage of development including initial scoping and pre-feasibility studies.
_rdax_620x285s.jpg)
Recently announced and updated significant projects included:
- Chevron’s Jansz-lo Compression upgrade project;
- Mitsui and Co’s Waitsia Stage 2 Expansion;
- Covalent Lithium’s Mount Holland lithium project;
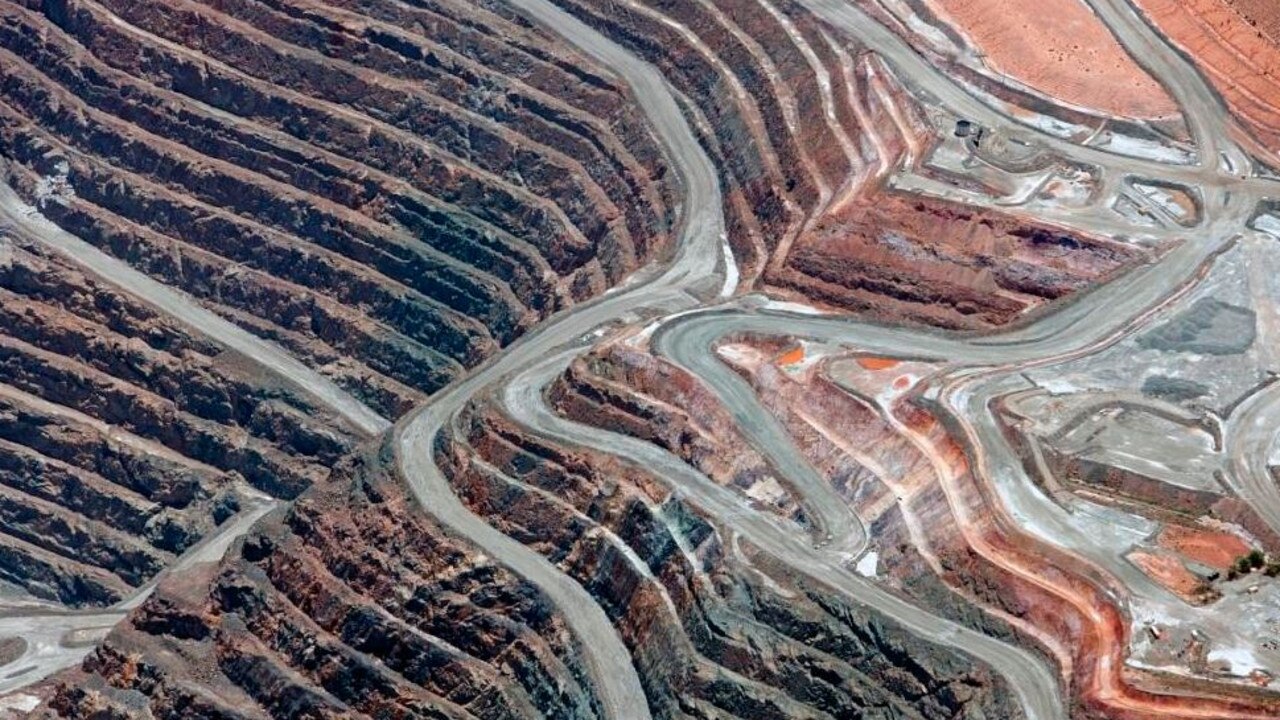
- Northern Star Resources’ Fimiston South cutback at the Super Pit; and
- APA Group’s Northern Goldfields Interconnector pipeline.
The value of projects under construction or in the committed stage of development was an estimated $37 billion, up from $28 billion in September 2020.
This increase largely reflects final investment decisions being made on the Jansz-lo Compression upgrade project, the Mount Holland lithium project, the Waitsia Stage 2 expansion, and APA Group’s Northern Goldfields Interconnector pipeline, as well as Adbri’s investment in upgrades at Kwinana cement operations. It was also due to several gold projects moving into the construction phase, as well as upward revisions to capital expenditure estimates.
Some projects were also completed and entered production, the most significant of which was FMG’s Eliwana mine.
The value of planned or possible projects increased from $100 billion to $103 billion between September 2020 and March 2021.
This increase was largely the result of capturing new gold, salt, titanium, tungsten, and silica sand projects, as well as a host of upward revisions in capital expenditure estimates across a range of commodities following the release of updated development studies.
Exploration
Mineral exploration expenditure in Western Australia was $1.7 billion, an increase of 5 per cent from $1.6 billion in 2019.
Growth in mineral exploration expenditure was mainly due to increased spending on gold (up $181 million), supported by record high prices. The other notable increases in spending were for iron ore (up $47 million) and nickel/cobalt (up $7.4 million).
The main targets of mineral exploration in Western Australia were gold (52 per cent), iron ore (22 per cent), and nickel/cobalt (9 per cent).
The State’s share of national mineral exploration expenditure was stable at 62 per cent, suggesting increased spending in Western Australia was matched across the rest of the country.

While mineral exploration expenditure in Western Australia increased overall, spending in the June quarter declined slightly compared to the same period in 2019. This was perhaps due, in part, to the impact of COVID-19 restrictions in Western Australia including regional travel restrictions, plus the cancellation and scaling back of exploration programs across the State. However, any negative effect on overall mineral exploration expenditure was short lived with the September and December quarters representing a return to growth.
The effect of COVID-19 on the location of expenditure was more pronounced with spending in greenfields areas falling by $119 million or 17 per cent year-on-year. The share of expenditure in greenfields areas compared to brownfields areas was just 33 per cent in 2020, down from 42 per cent in 2019.

Petroleum exploration expenditure in Western Australia was down almost half in 2020 to $379 million, after growing in 2018 and 2019.
This was the result of cuts to exploration budgets in response to the fall in oil prices to a 20-year low.
Lower spending in Western Australia, combined with increase expenditure in Queensland, resulted in Western Australia’s share of the national spend declining to 40 per cent from 54 per cent the previous year.
Royalties
_rdax_620x327s.jpg)
The Western Australian Government received royalty revenue from the State’s minerals and petroleum producers totalling $9.1 billion in 2020. This was an increase of 7 per cent on 2019, but down marginally on the record $9.3 billion received in 2019-20.3
Royalty receipts from the iron ore industry grew by nearly $1 billion or 12 per cent on the previous calendar year due to higher volumes and prices. The industry’s share of total royalty revenue also increased to 86 per cent from 82 per cent the previous calendar year.
Consistent with the strong market conditions seen in the gold industry, its royalty payments rose by 31 per cent to a record $411 million.
Conversely, challenging market conditions for the alumina and lithium industries resulted in royalty payments falling by 23 per cent and 43 per cent respectively.
Western Australia’s grants from the North West Shelf project also fell by 35 per cent amid lower oil prices.4
3Refers to royalties for all minerals and petroleum produced on State land and in State waters are paid into the Government’s Consolidated Revenue Fund. Included in the royalty receipts for petroleum is the Commonwealth’s share of royalties collected under the Petroleum (Submerged Lands) Act 1967. Included in the State’s royalty receipts for iron ore is an additional lease rental amount which is currently applied under Iron Ore State Agreement Acts and the Mining Act.
4The State receives about 65 per cent of the royalties from the petroleum produced by the North West Shelf Project, in the form of Commonwealth grants, in accordance with an agreement between the Western Australian and Australian Governments.
Principal resource projects
WA’s mining industry consisted of 123 predominantly higher-value and export-oriented mining projects in 2019-20.
The State’s mining industry also comprised hundreds of quarries and small mines producing clays, construction materials, dimension stone, gypsum, limestone, limesand, and spongolite for the local construction industry.
There were also 13 major mineral processing operations which transform bauxite into alumina; gold dorè into gold bars; nickel concentrate into nickel matte, nickel powder and nickel briquettes; rutile and synthetic rutile into titanium dioxide pigment; zircon into fused zirconia; and silica sand into silicon metal.
The number of gold projects was up to 52 in 2019–20 from 47 in 2018–19. The increase is predominantly due to the high price environment providing an incentive for the restart of small-scale gold mines. The number of iron ore and nickel projects was also up with the re-commencement of mining operations at Kimberley Metals Group’s Ridges iron ore project and First Quantum Minerals’ Ravensthorpe nickel project amid more favourable market conditions.
There were 22 principal petroleum projects producing oil, gas and condensates from 53 fields onshore and in the Commonwealth waters around WA. These projects had 13 processing plants, predominantly for LNG exports and domestic gas sales.
The total number of petroleum projects was down from 23 in 2018–19, with the end of production for Mitsui and Co’s Dongara gas project. The number of producing fields also decreased from 57 fields, largely due to a change in fields at the North West Shelf, Varanus Island, Waitsia and Enfield projects.
For an overview of how Western Australia’s key commodities performed, please see 2020 mineral and petroleum commodity review.
Western Australia’s Principal Resource Projects
Western Australia’s principal resource projects (2019-20) – 430 Kb
Western Australia’s principal resource projects (2019-20)
Western Australia’s principal resource projects (2018-19) – 272 Kb
Western Australia’s principal resource projects (2018-19)
Western Australias principal mining projects (2017-18) – 143 Kb
A list of Western Australia’s principal mining operations by commodity and financial year.
Western Australias principal mining projects (2014-15) – 119 Kb
A list of Western Australia’s principal mining operations by commodity and financial year.
Western Australias principal mining projects (2015-16) – 115 Kb
A list of Western Australia’s principal mining operations by commodity and financial year.
Western Australias principal mining projects (2016-17) – 116 Kb
A list of Western Australia’s principal mining operations by commodity and financial year.
Join our Facebook community with over 105,000 active Australians


